Shopify

WooCommerce
Metorik is great at showing fundemental financials. Kiito is built for improving them.
Kiito focuses on insights that help you take action to improve your business.
Kiito has sections for products, ads, traffic sources and customer lifetime value. Under each section, you will find the following features.
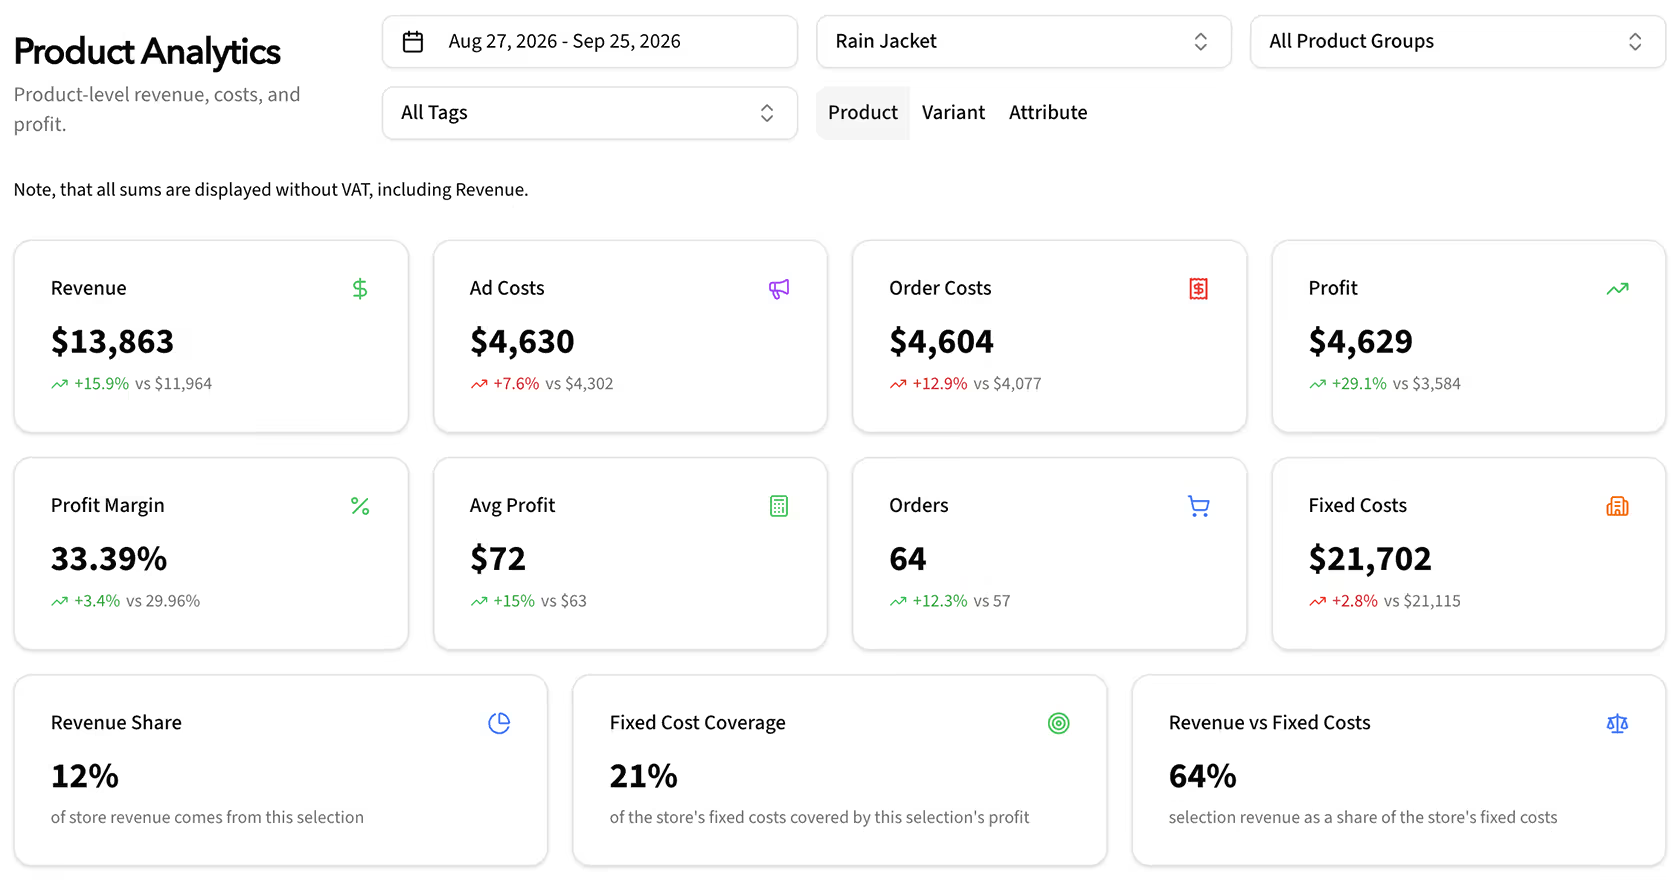
Core KPIs in each section. Overall, how did your business do during the period?
For products, categories, tags, campaigns, ad sets, ads, keywords, traffic channels, UTMs and more!
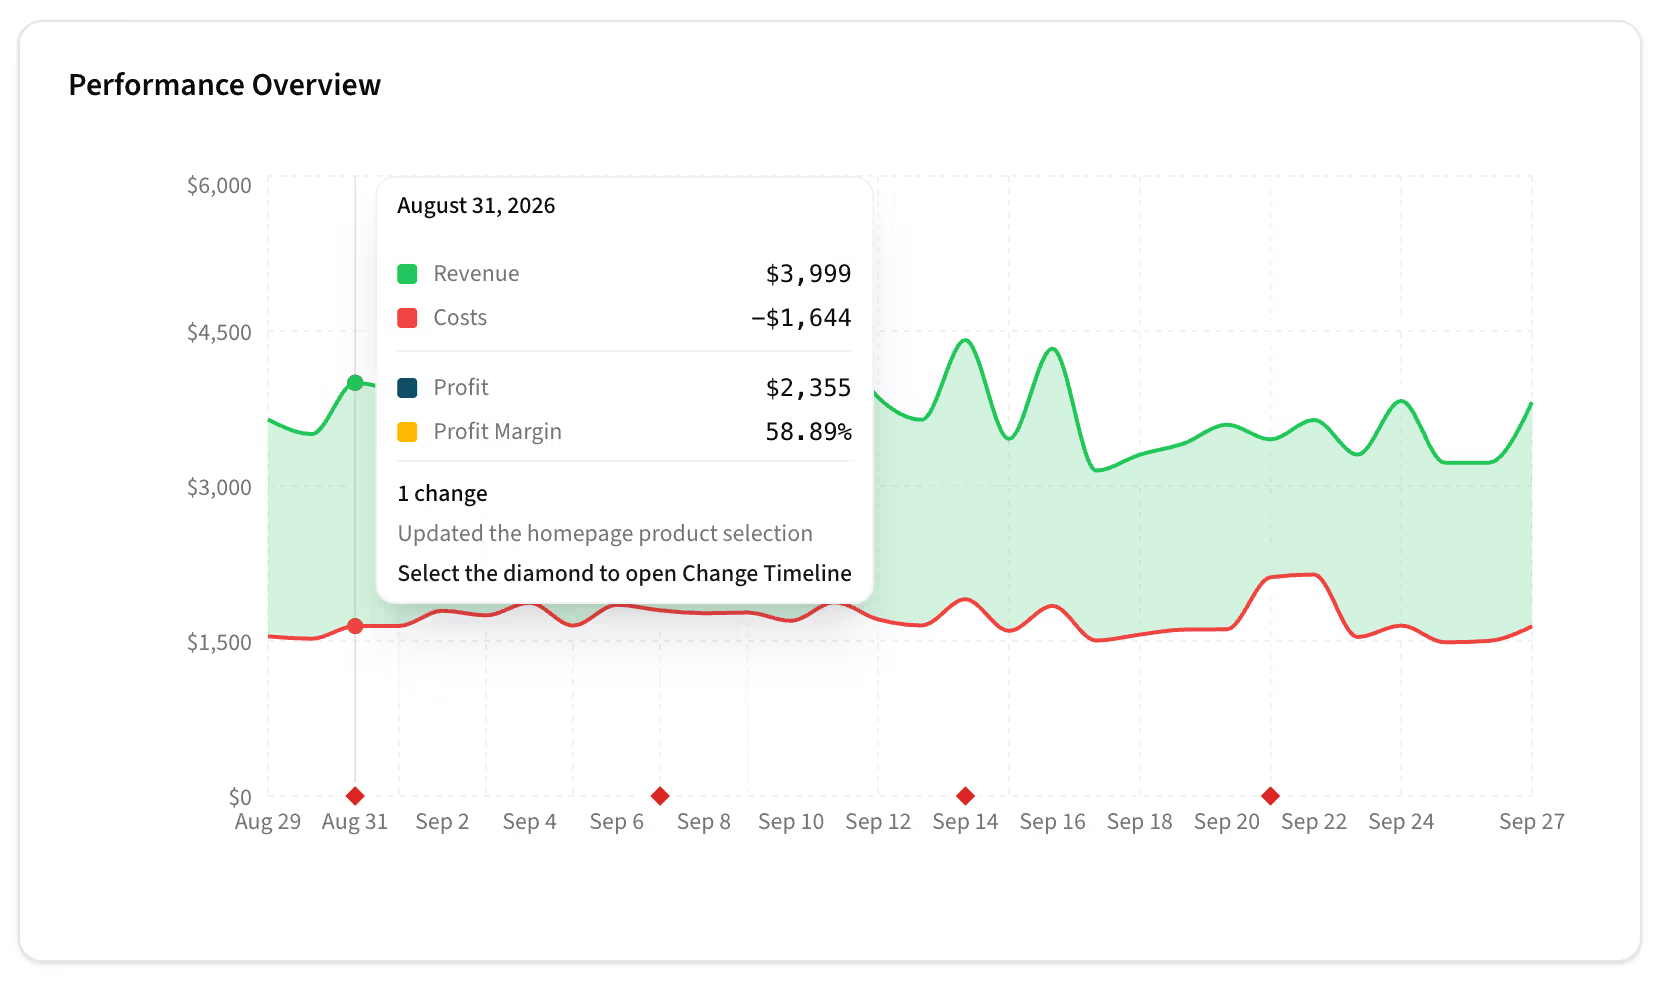
Easy-to-read daily graphs, with financials and change details.
For products, categories, tags, campaigns, ad sets, ads, keywords, traffic channels, UTMs and more!
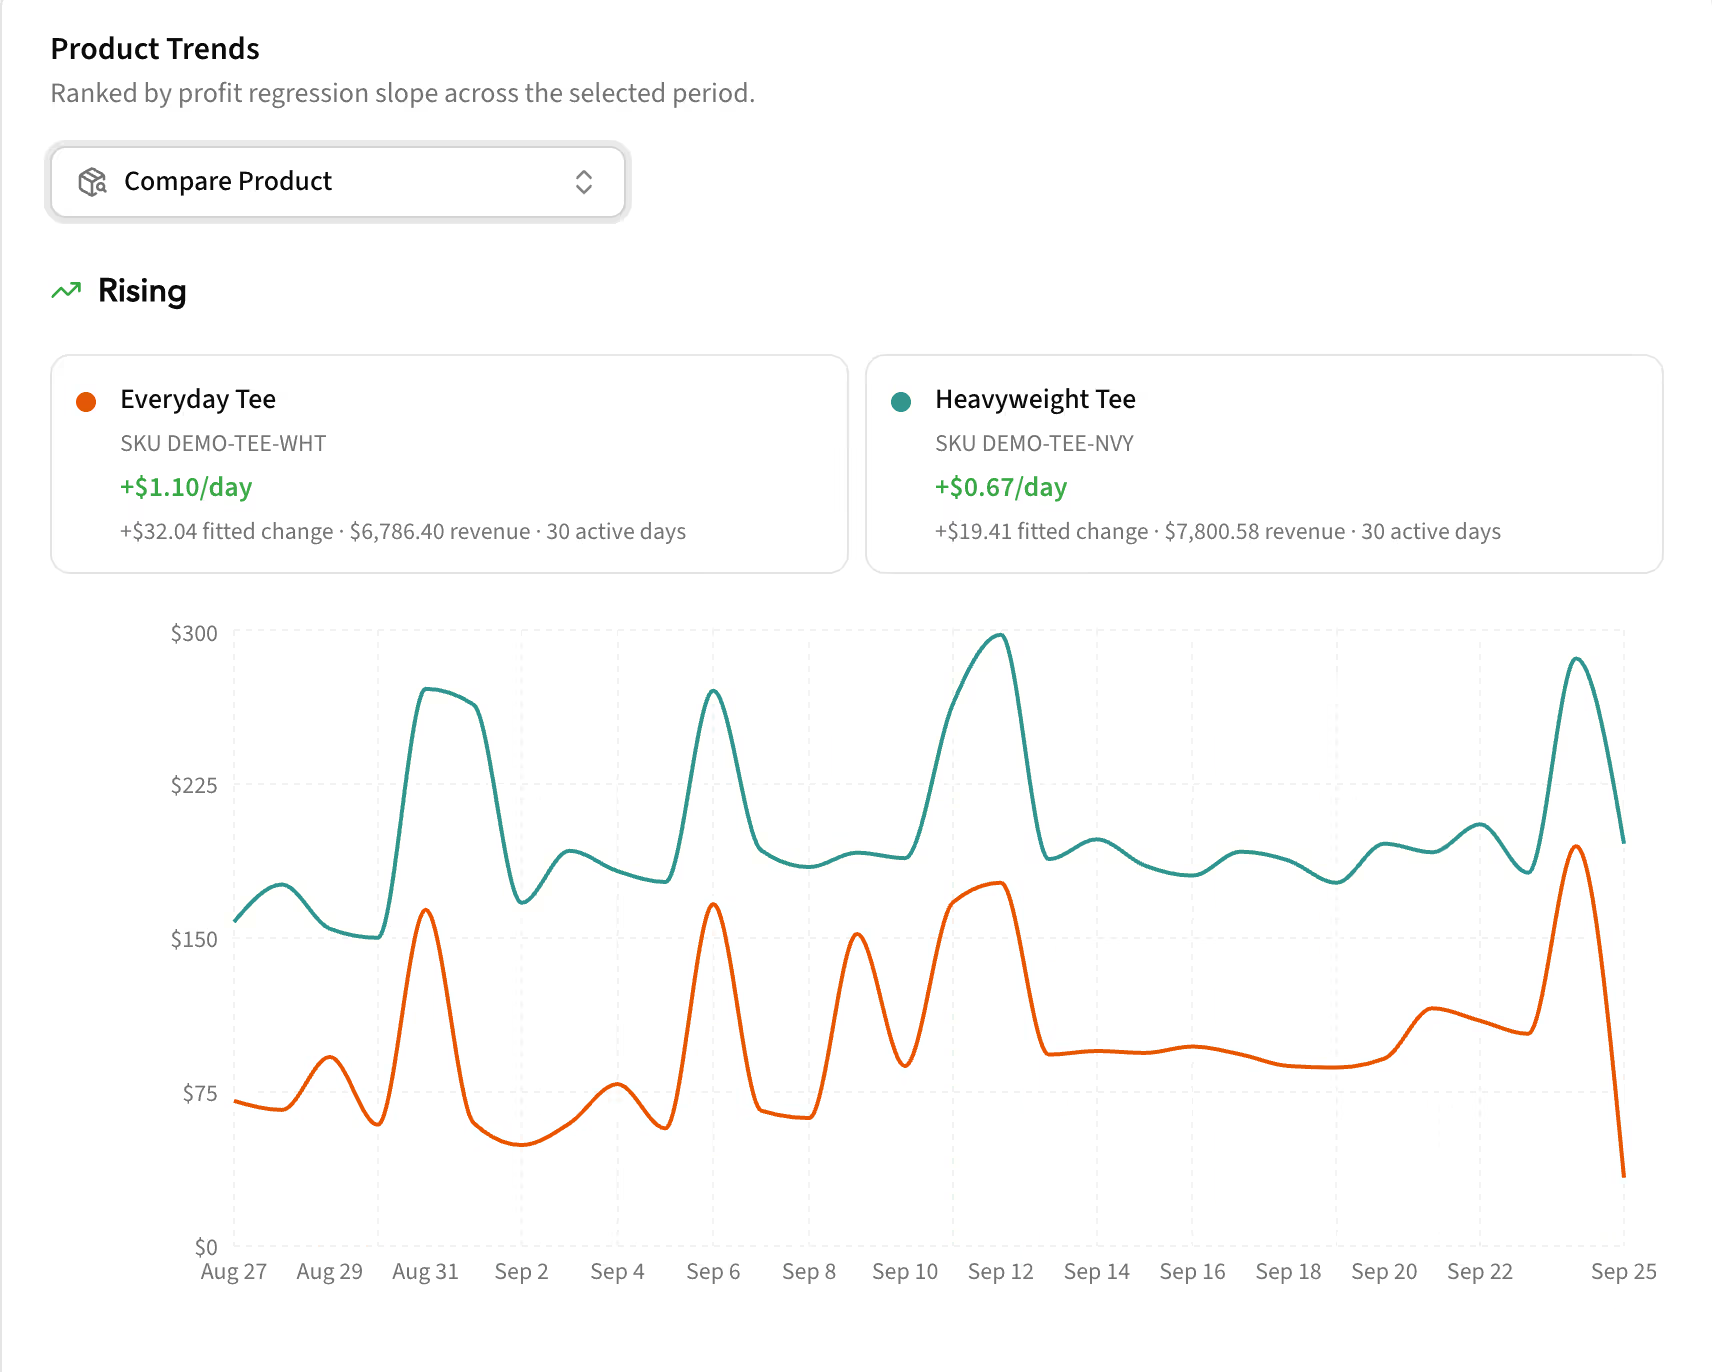
Kiito shows which items start to trend up or down. Notice fatigue early and react to it.
For products, categories, tags, campaigns, ad sets, ads, keywords, traffic channels, UTMs and more!
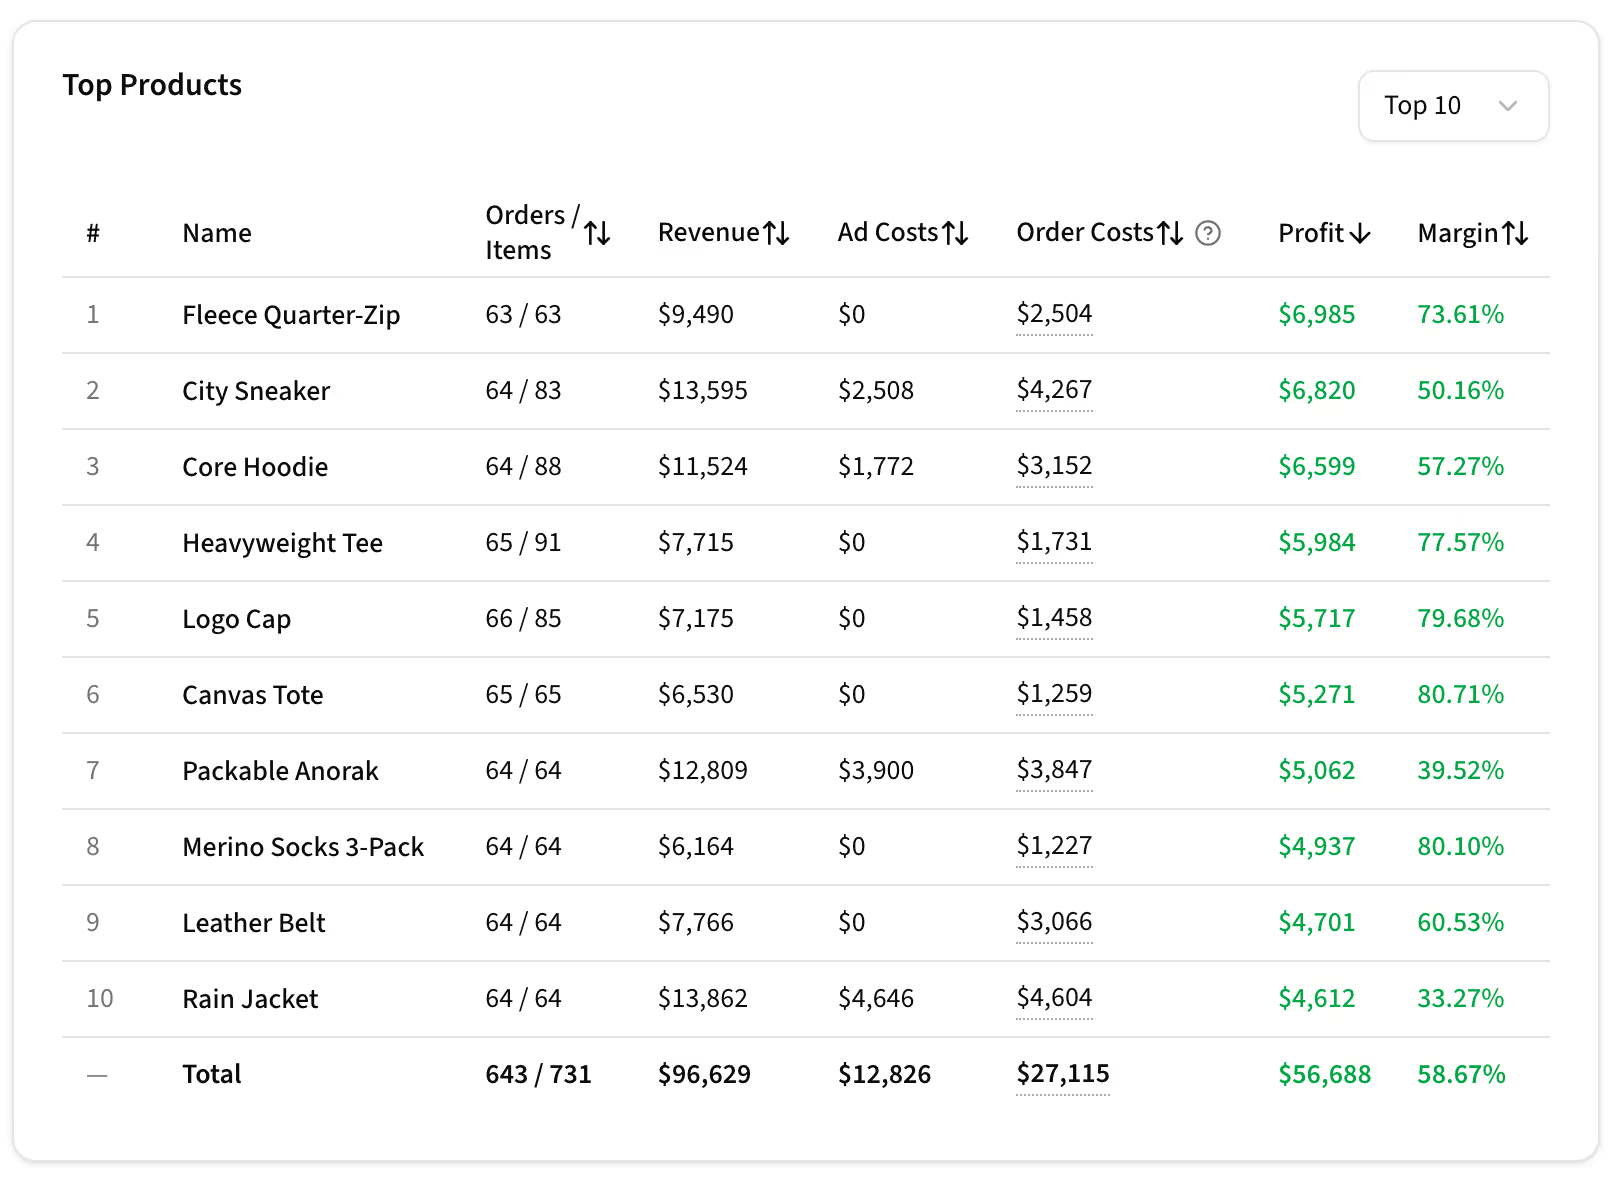
Best and worst performers. Product or campaign selling well might not actually be the best when all costs are added up.
For products, categories, tags, campaigns, ad sets, ads, keywords, traffic channels, UTMs and more!
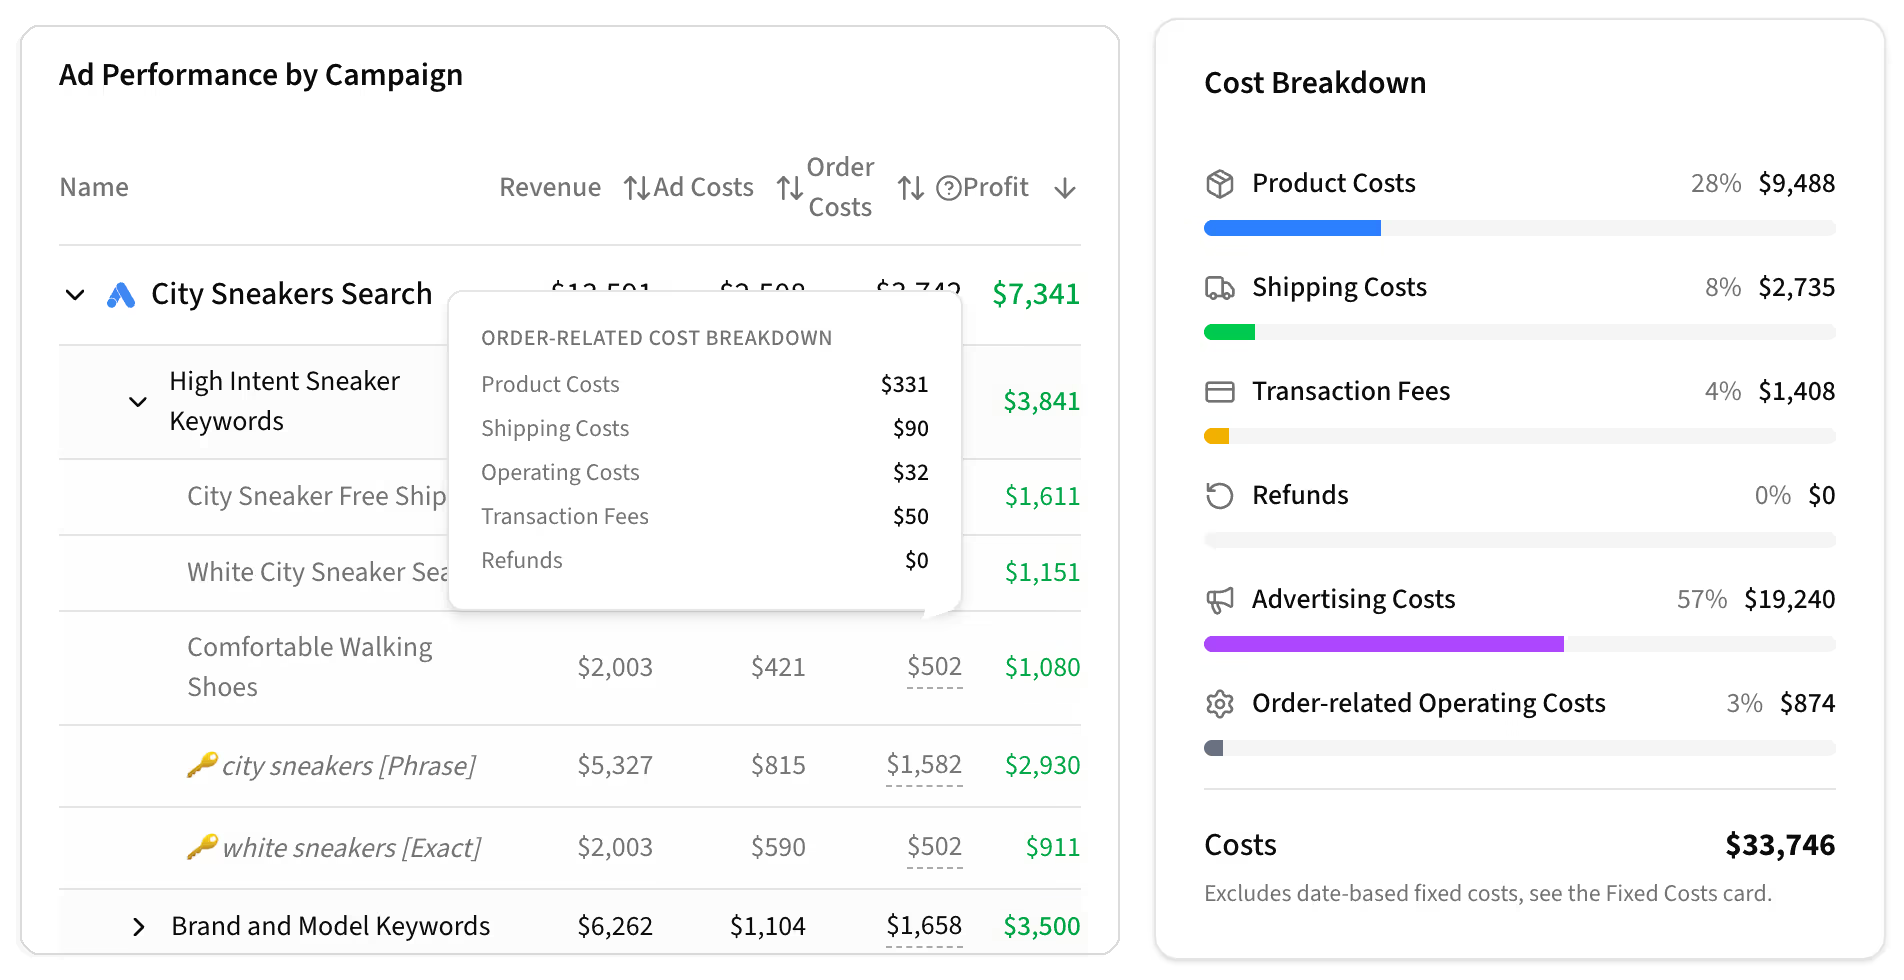
Cost breakdowns per individual item and overall.
For products, categories, tags, campaigns, ad sets, ads, keywords, traffic channels, UTMs and more!
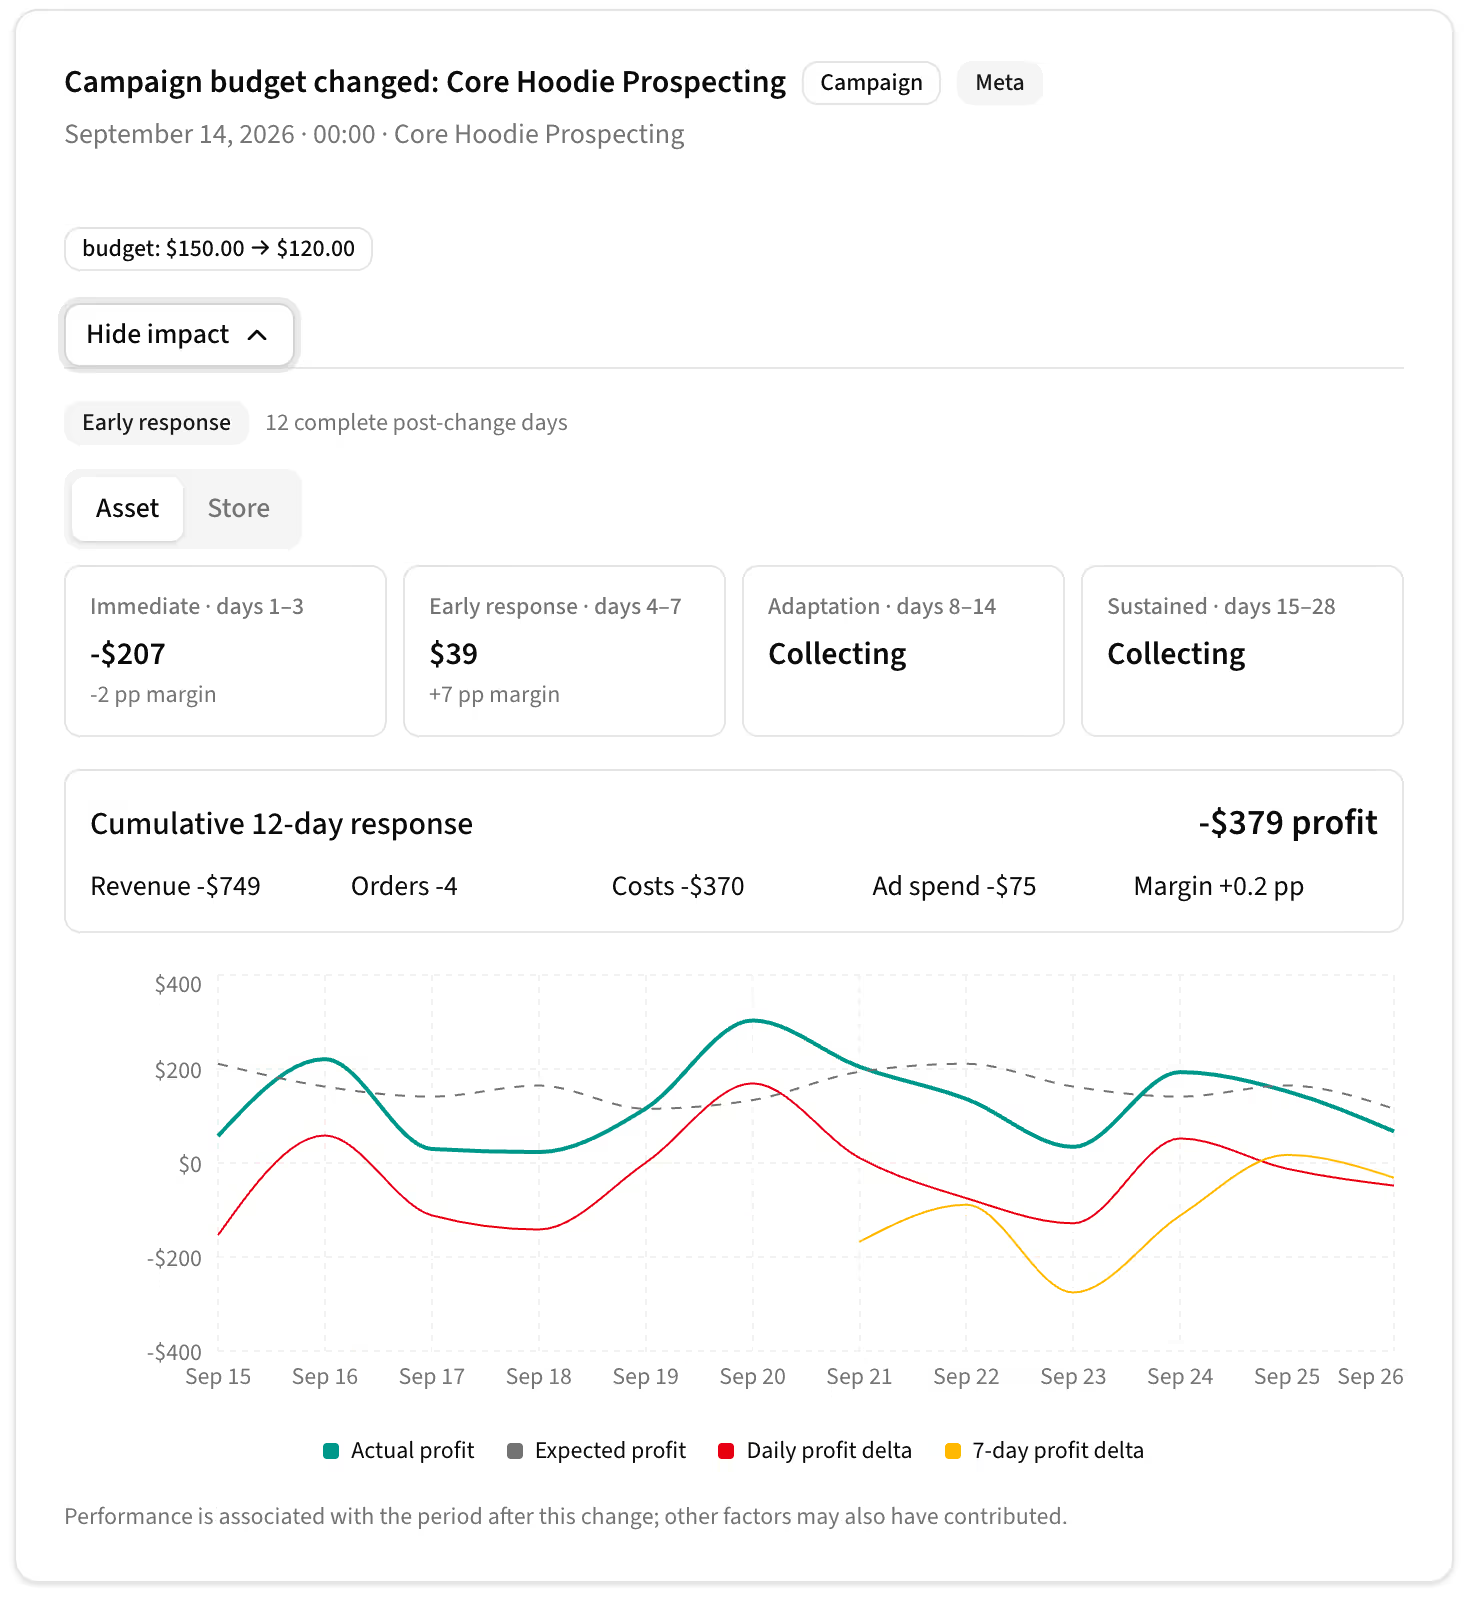
Price, budget and status changes are logged automatically. See each change on the timeline and how it affected the financials.
For products, categories, tags, campaigns, ad sets, ads and keywords.
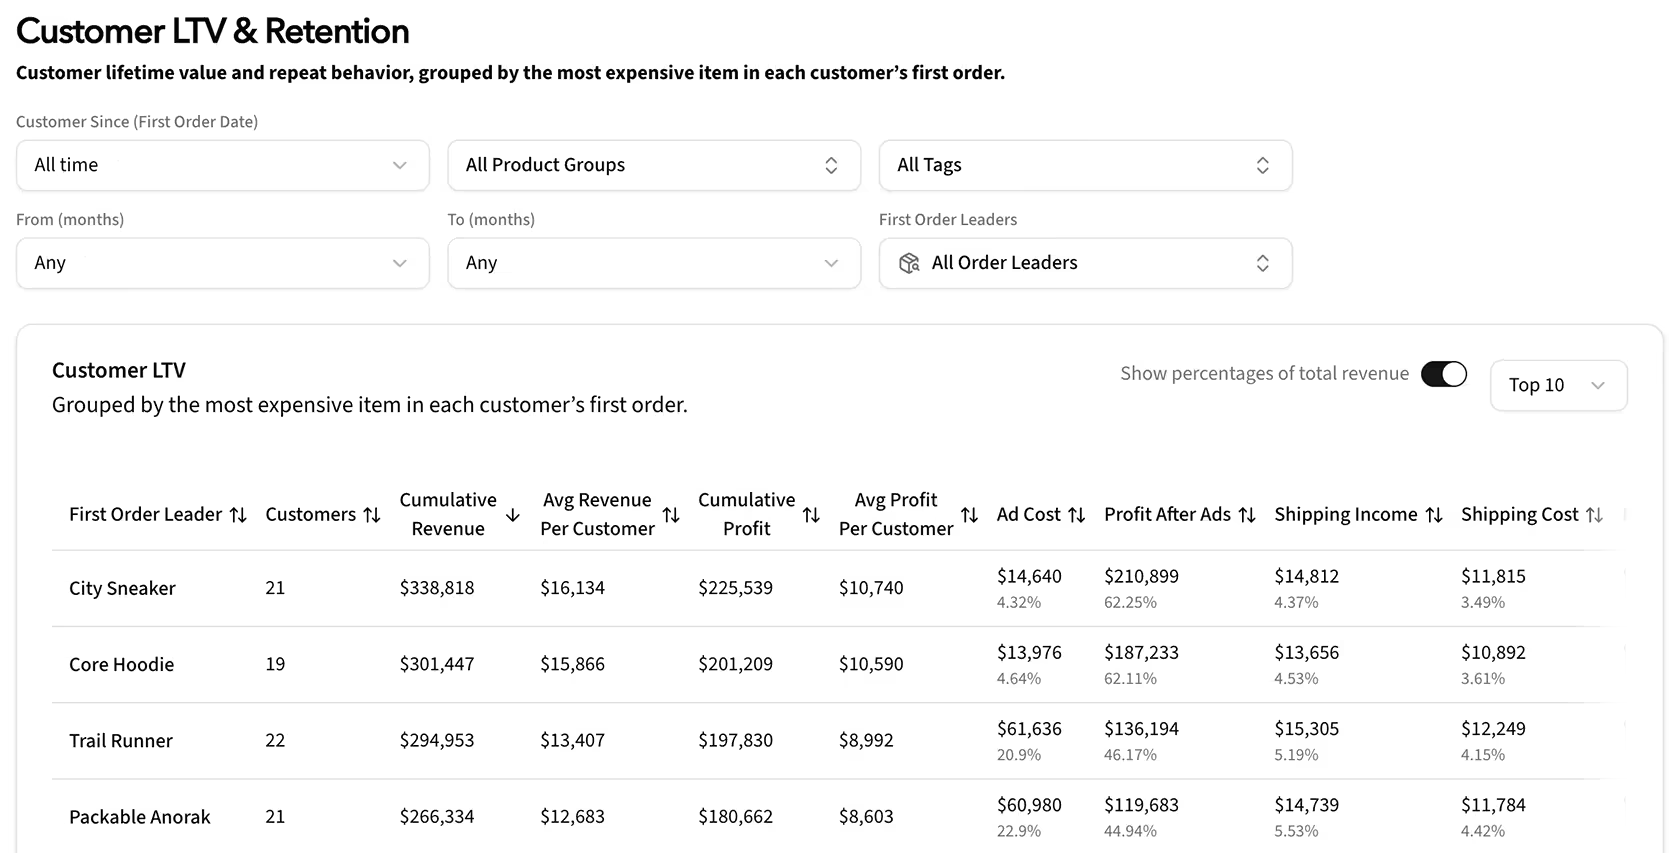
See which products, categories and tags bring in the most profitable customers, measured by lifetime value.
For products, categories and tags.
Metorik shows only the last visit and attributes the full order revenue to it. Imagine a customer discovers your store through a Facebook ad, returns through Google search, and later makes a purchase after a direct visit – or worse, gets redirected to the site via the payment gateway. The important data from those previous visits is lost.
Kiito's multi-touch attribution records all visit sources for each customer, so it can credit the sources properly and you are able to see the full customer journey.
As a WooCommerce user, you get access to our private MTA Pro plugin, which fingerprints the visitor's device, and matches the visitor even if their IP address changes, they switch browsers, or cookies are cleared or disabled.
The most common scenario where cookies are lost is when people first click an ad in an in-app browser, such as Facebook’s, but later visit the site in their regular browser.
MTA was able to identify the correct source for 140 of 634 orders, where WooCommerce either identified the order incorrectly as "Direct" or mistaken a payment gateway for the referrer (a common problem with WooCommerce stores).
MTA Pro's fingerprint matching linked 517 of 6,737 recorded visits to an existing visitor identity, helping reconnect customer journeys when other ways of matching the customer failed.
Sales reported by advertising platforms can often be off by around 10–30%. That difference can make seemingly profitable products immediately unprofitable.
Kiito uses multiple methods to get as close to 100% accuracy as possible:
Kiito shows how much revenue each individual campaign, ad set, ad, and search keyword generates, and what each one costs. Metorik, on the other hand, does not offer advertising attribution.
When a product price or ad budget changes, can you see how it affects revenue, profit, and profit margin over the following days and weeks?
With Kiito’s Change Timeline, that becomes easy. It automatically records changes made in your store and ad platforms, then tracks their impact. With a single click, you can see how each change affected revenue, profit, and profit margin.
Changes are also marked directly on all daily graphs, making it easier to understand what caused movements in the data.
And the history stays there. Say you’re looking back at analytics from six months ago. Without change tracking, you may no longer remember what happened at the time. Kiito still shows the changes made on each day, so you can interpret the data in the right context.
Kiito Trends surfaces rising and declining products, ads, and traffic sources based on revenue, profit, or margin. A large campaign’s totals can hide a weakening ad, while a smaller product gaining profit may deserve a closer look.
Open the underlying report to investigate the movement and its costs. Trends gives you a clear starting point without requiring you to check every product and campaign individually.
Your monthly price is based only on the ecommerce store revenue we track. Other sales channels and total business revenue don’t affect your price.
Improve your profit within 30 days, or we’ll refund your payment.
In 2022 I started my own DTC ecommerce brand, Zaint. I was happy with the numbers in the advertising platforms. We easily had 3-5x ROAS most of the time. It seemed like we were making good money, yet I realized that our bank balance was actually shrinking.
So I decided to find out why. I wasn’t satisfied with the ecommerce analytics tools available. Many didn’t focus on profit or lacked detailed advertising attribution. Others locked important features behind plans costing hundreds of dollars per month, even for a small store.
I’ve been a software engineer for more than 20 years. As a teen I made visitor counters that served thousands of requests per second from two servers in my closet. Then worked as a consultant for advertising agencies and large online businesses through my own company. So the solution was obvious.
I started developing Kiito with one goal: helping ecommerce stores improve their profitability. It launched in the summer of 2026 – this time running on AWS servers in France instead of in my closet.
With Kiito, we were able to see which ads and keywords were actually profitable and which products had the best margins after accounting for all costs. Most importantly, I saw that we needed more paid traffic to cover our fixed monthly costs. We increased Zaint’s profit margin from around 0% to 30%. It’s amazing how helpful eye-opening statistics can be.
If you have any questions, feature suggestions or aren’t sure whether Kiito is suitable for you or your client, hit me up at niko@kiito.io and I’ll personally get back to you as soon as I can.